Ingrid Lönnstedt: ”The confidence interval and its width”

The results of a study may often be presented as an estimate and its confidence interval: The increase in lung capacity FEV was 0.30 litres (0.11 to 0.49 litres). The median survival was 16 months (11 to 26 months). The decrease in systolic blood pressure was on average 23 mmHg (-7 to 53 mmHg).
The estimate (or point estimate) of a variable, the mean or the median in these examples, is our best guess of a treatment effect. The average effect across a million patients, or the true effect, is probably different from our observed mean increase in FEV, but it is likely not too far away. The confidence interval specifies the precision of the estimate – how good is the estimate?
With a large study there is a lot of information, which gives a high confidence that the true treatment effect is close to the estimated mean. With a small study, or a study in which data has a larger variance, there is less confidence in the estimate, so a confidence interval of the same confidence level (usually 95%, see footnote*) will be wider than for the study that is larger or has a smaller variance.
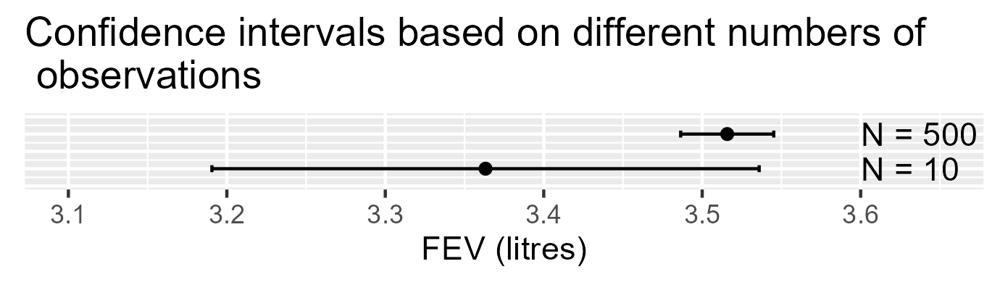
The figure above shows 95% confidence intervals for two samples, one small (N = 10) and one large (N = 500), simulated with the same true mean (FEV 3.5 litres). Even if we did not know the sample size, the width of the confidence intervals reveal that the N = 500 estimate has a much better precision – a higher level of confidence - than that of N = 10. An estimate with a very wide confidence interval needs to be taken with a pinch of salt!
The exact meaning of a confidence level is slightly complicated. One could believe that a 95% confidence interval would have 95% probability to cover the true mean. That interpretation is not correct, but there is a high probability that the true mean lies within the interval.
Confidence intervals have other useful properties, for example for drawing statistical conclusions (hypothesis testing)
Sometimes you will see studies that are small enough to be pretty useless. A study where 4 out of 10 patient responded gives an estimated treatment effect of 40% and the 95% confidence interval for the effect is 14 to 73%. If the interval needs to be that wide to reach 95% confidence level, then data says almost nothing about the fraction of future patients who might be helped by the treatment. This is where I would take that pinch of salt: instead of indicating confidence, the interval indicates the opposite! The imprecision is not revealed by the 40% estimate itself. The confidence interval summarizes both the estimate, as that lies within the interval, and its lack of precision. It is hence much more informative. It may reveal an insufficient study, and can be used to compare the qualities of estimates from different studies.
Confidence intervals have other useful properties, for example for drawing statistical conclusions (hypothesis testing). But the information in the interval width is reason enough to use them frequently. Always keep an eye on the width of your and others’ confidence intervals!
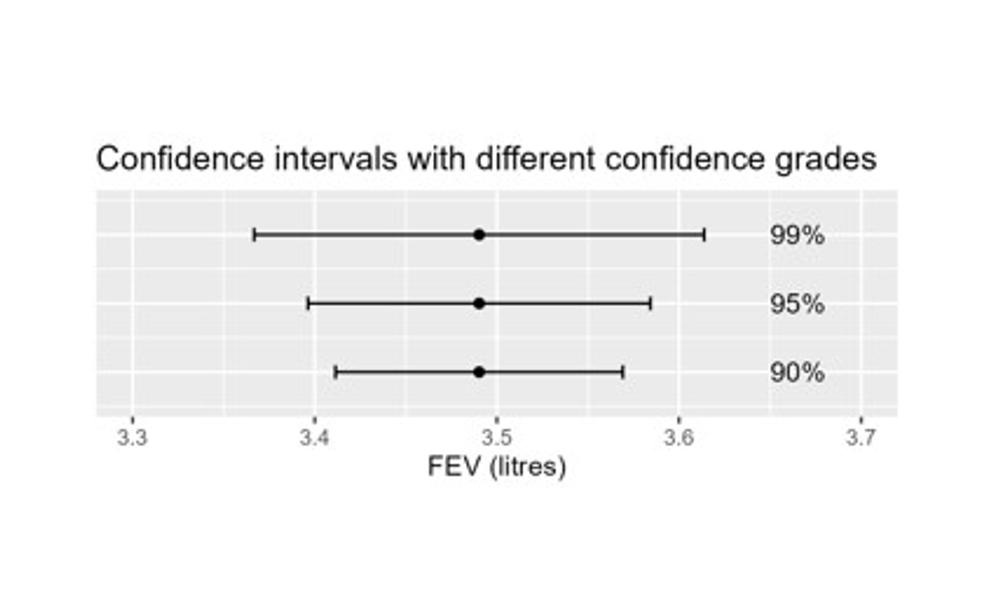
*Most commonly, confidence intervals are given at the 95% confidence level, but occasionally a different confidence level is used, like 90% or 99% in the figure below. The 90% confidence interval is narrower than the 95% confidence interval from the same data, as is does not require as high level of confidence, and the 99% interval is wider.
Artikeln är en del av vårt tema om News in English.